When I published my recent visualization of populations near Montreal train stations, some people told me that I should consider extending it with data showing work places as well. This makes sense as a way to gauge ridership. People go from home to work, so work places are an indicator of potential ridership just as much as population (if not more – every work place is being traveled to, but not every home place is being travelled from).
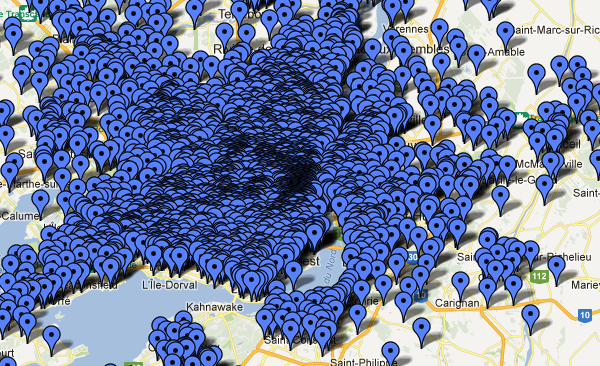
The problem is that I couldn’t find much useful data for work places. This may just be my bad googling skills, or maybe census data should be easier to find. In any case, I found these maps from the 2006 census, showing places of work on maps. The maps come in pdf format and are vectorized. Dots represent some number of workers, for the Montreal map every dot represents 500 workers:
Now this seems like a bad source to extract data, but not all is lost. Being in a vectorized format, we can actually extract the location of the dots. And if we rectify the image using a couple of geo references, we can transform the location of the dots back to lat/lng points. The following process is a bit hacky, and not entirely accurate (the dots’ accuracy should be around 100m), but it provides a quick(ish) and dirty way to extract the data.
1. Prepare data for extraction
The way vectorized pdfs can be dealt with beautifully is Inkscape. It is basically an open source version of Adobe Illustrator, it is to Illustrator as Gimp is to Photoshop. The software is really useful for our purposes because it allows importing vectorized pdf files, it allows editing them, and it stores imagery data as svg files. Being an xml, we can extract our information right out of Inkscape produced files using python and xml libraries. It really is my go-to solution for scraping non-text information out of pdfs.
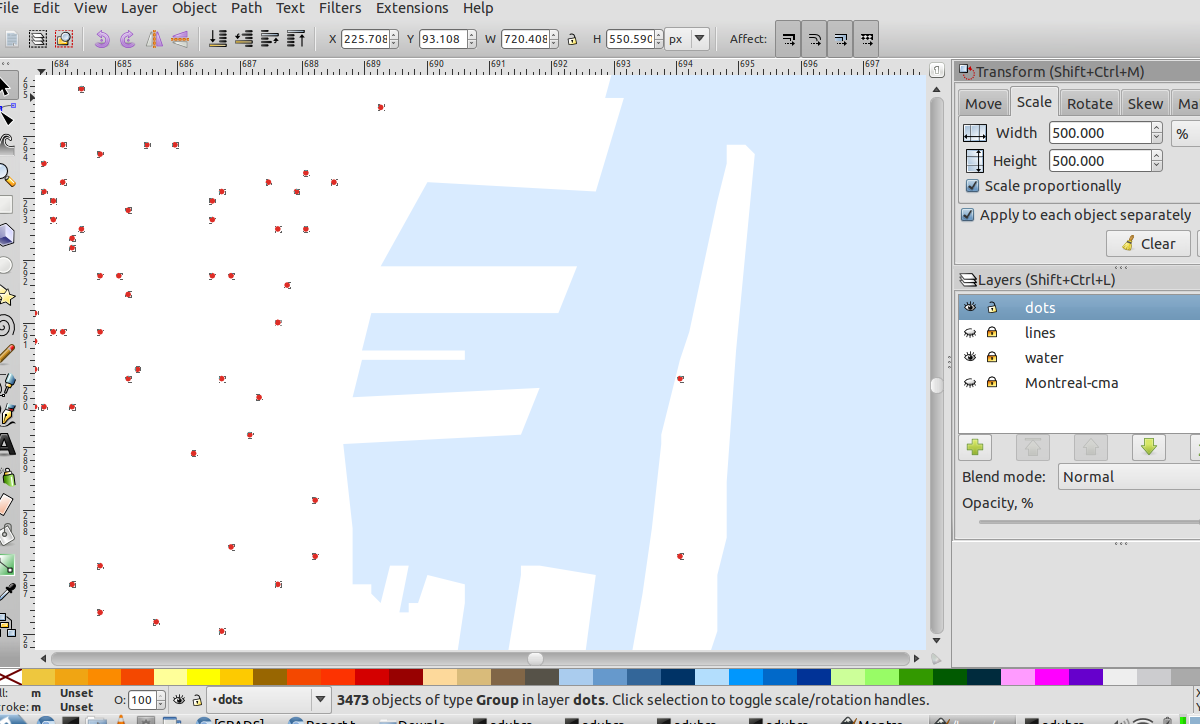
In order to extract the data, we have to first prepare at a bit though. After importing the svg into Inkscape, we have to make sure all our data can easily be extracted. For the Montreal Work Place pdf, I first separated the data into multiple layers. I was interested in the dots. They were actually grouped together in one group. This is not good, because locations of objects inside groups are stored relative to the position of the group. We need the objects as paths living directly in the layer, so the objects need to be ungrouped. This gave me 3473 objects of type group (see the image below). Apparently the dots are all inside groups containing the single dot. So we need to ungroup again.
The next problem is that the data is at the center of the dots, but the dots were represented by paths of four nodes, forming a circle. In order for the first node in the path to correspond to the data, we simple resize the dots, individually until they are so small that the circle becomes invisibly small.
We also need a way to extract the points later in python, so we need a way to differentiate those path objects from other path objects. The simple way in this case was to select them based on their color – all the dots and only the dots have a fill property with value #de2d26. Properties like these can easily be found by using Inkscape’s builtin xml editor (Edit-›Xml Editor).
So now my data was prepared. I knew that all the data was in the paths which have a fill property of #de2d26, and its location corresponded to the first node in the path.
2. Find geo-references
We can now extract the data, but we will only know the image coordinates of the data. In order to get the world coordinates of the data (i.e. lat/lng values), we need to find the projection that the image uses. This could be done with geo-referencing tools that come with software like QuantumGIS. But since our map covers a small geographical area, an affine Transformation between the pdf map and the 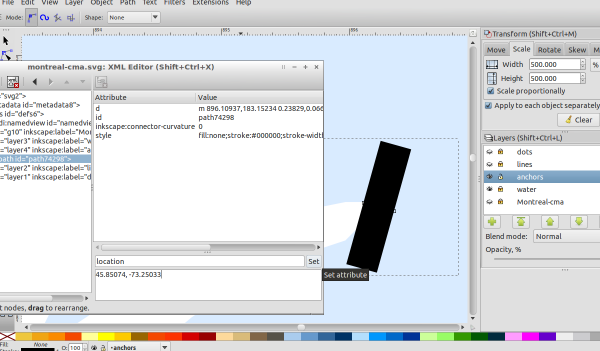
I created 12 such reference points, so that the errors I make in creating them will (hopefully) cancel out.
3. The extraction script
In the final step I used the below script to extract the data. It’s written in python, and uses xpath and mercator.py.
It first finds all the paths that have a “location” attribute – those are my reference points. It then finds the image coordinates, and the world coordinates. The script will also extract extract locations of all the data points, by finding paths that have the fill property to look for. Note how XPath (a query language to select nodes in xml documents) makes this really easy.
The script will then project the lat/lng points into the Mercator projection, and find a least square best fit for a affine transformation matrix between the image coordinates and the world coordinates (in Mercator space). The data points will be transformed to world coordinates using this transformation and unprojected to get the lat/lng values.
The script prints the data values (lat,lng,data) as a csv on stdout. The errors (in meters) of the reference points will be printed on screen, to give an idea how good the transformation is.
from lxml import etree
import numpy as np, sys, math
import mercator # mercator.py from github

# setup
file = 'montreal-cma.svg';
data = 500 # every found point will have that data value

# open/parse svg file
f = open(file);
t = etree.parse(f);

# set namespace
ns={'svg':'http://www.w3.org/2000/svg'}

# function: given an svg path element, returns coordinate of first point
def getFirstPointInPath(p):
    return [float(s.strip()) for s in p.attrib['d'].split()[1].split(',')]

# function: given a lat1,lng1,lat2,lng2, returns the distance in meters
def dist(lat1,lon1,lat2,lon2):
    R = 6371000
    piOver180 = math.pi/180;
    dLat = (lat2-lat1)*piOver180;
    dLon = (lon2-lon1)*piOver180;
    lat1 = lat1*piOver180;
    lat2 = lat2*piOver180;
    a = math.sin(dLat/2)*math.sin(dLat/2)+math.sin(dLon/2)*math.sin(
          dLon/2)*math.cos(lat1)*math.cos(lat2)
    c = 2 * math.atan2(math.sqrt(a), math.sqrt(1-a));
    d = R * c;
    return d;


# get reference points - path which contain a 'location' attribute
paths=t.xpath('//svg:path[@location]',namespaces=ns)
refPoints = []
for p in paths:
    [lat,lng] = [float(s.strip()) for s in p.attrib['location'].split(',')]
    [x,y] = getFirstPointInPath(p)
    refPoints.append({'lat':lat,'lng':lng,'x':x,'y':y})

# get data points - path which contain fill:#de2d26
paths=t.xpath('//svg:path[contains(@style,'fill:#de2d26')]',namespaces=ns)
dataPoints = []
for p in paths:
    [x,y] = getFirstPointInPath(p)
    dataPoints.append({'x':x,'y':y})

# project reference point via mercator
zoom = 0
for p in refPoints:
    [p['tilex'],p['tiley']] = mercator.get_lat_lng_tile(
                                p['lat'], p['lng'], zoom)

# find an affine transformation between image x,y and tile x,y
# first collect points
imageCoords = []
tileCoords = []
for p in refPoints:
    imageCoords.append([p['x'],p['y'],1])
    tileCoords.append([p['tilex'],p['tiley']])

# get (affine) transformation matrix
X = np.matrix(imageCoords)
Y = np.matrix(tileCoords)
M = np.linalg.lstsq(X,Y)[0].T

# test how good the match is
# - we'll print that to stderr, because stdout is for the data
refImagePoints =  np.matrix([[p['x'],p['y'],1] for p in refPoints]).T
refTilePoints = (np.matrix(M)*refImagePoints).T
refLatLngPoints = [mercator.get_tile_lat_lng(
                      zoom,refTilePoints[i,0],refTilePoints[i,1])
                   for i in range(len(refTilePoints))]
distances = np.array(
     [dist(
         refPoints[i]['lat'],refPoints[i]['lng'],
         refLatLngPoints[i][0],refLatLngPoints[i][1])
      for i in range(len(refPoints))])
sys.stderr.write('mean distance: '+str(distances.mean()))
sys.stderr.write(', max: '+str(distances.max())+'\n')
sys.stderr.write('\n'.join(str(e) for e in distances)+'\n')


# get tile coordinates of data points, and unproject them
dataImagePoints = np.matrix([[p['x'],p['y'],1] for p in dataPoints]).T
dataTilePoints = (np.matrix(M)*dataImagePoints).T
dataLatLngPoints = [mercator.get_tile_lat_lng(
                      zoom,dataTilePoints[i,0],dataTilePoints[i,1])
                    for i in range(len(dataTilePoints))]

# print info to screen (as csv)
for row in dataLatLngPoints:
    print str(row[0])+','+str(row[1])+','+str(data)
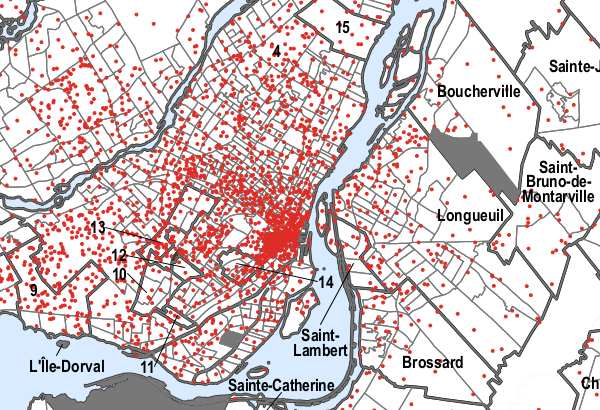
Note that for this particular data source, the points are very approximate in any case. But the match appears to be pretty good. The mean error on the reference points itself is about 72m, the match on the final result looks a bit better than that. Check out the result in google maps.